Why Query Latency Gets Worse as Your Application Scales
Query latency rarely degrades because of one slow query. It degrades because concurrency, data volume, and the distance between where data lives and where applications run all grow at the same time.
One query's time has three parts: the queue grows with concurrency, execution with table size, and the network leg with distance. A local copy of hot data, kept fresh by replication, removes the queue and the network leg from reads.
A query that returns in 20 milliseconds in staging can take 800 milliseconds in production a year later, with the same schema and the same indexes. Teams usually respond by tuning the query, and tuning sometimes helps. But when latency degrades gradually as an application grows, the cause is usually not a bad query plan. It is the architecture: the request path between the application and its data has changed shape, and the query is paying for it.
This guide explains the three forces that push query latency up as applications scale, why the standard fixes (indexes, read replicas, caching, bigger instances) each plateau, how to diagnose which force dominates a given workload, and the architectural patterns that keep latency flat instead of merely postponing the problem.
The Three Forces That Drive Latency Up
Query latency at scale is the sum of three mostly independent factors. Each grows for a different reason, which is why a fix aimed at one rarely moves the others.
Concurrency and queueing
Databases serve queries from a finite pool of workers, connections, and I/O bandwidth. At low utilization, a new query starts immediately. As utilization rises, queries increasingly wait for a worker or a lock before they execute at all. This queueing delay is invisible in EXPLAIN output because it happens before execution starts, yet it often dominates production latency. Doubling traffic on a database at 40% utilization may add little latency; doubling it again can multiply tail latency several times over, because wait time grows non-linearly as a system approaches saturation.
Data volume and scan cost
Queries that were fast at one million rows behave differently at one billion. Index depth grows, working sets stop fitting in memory, and the buffer cache hit rate falls, so reads that used to be served from RAM now touch disk. Aggregations and analytical scans degrade fastest, because their cost is proportional to the data scanned rather than to the result size. Data growth also erodes fixes silently: an index that once covered the hot path stops fitting in memory, and latency creeps up without any change to the query.
Distance between data and application
As applications scale, they spread out: more services, more regions, more availability zones. The data usually does not spread with them. A query from a service in one region to a database in another pays tens of milliseconds of network round trip before the database does any work, and a request that issues five sequential queries pays that cost five times. This is the architecture gap: applications scale horizontally and geographically, while the data stays centralized, so the average distance between a query and the data it needs keeps growing.
Why the Usual Fixes Plateau
Each standard remedy addresses one of the three forces, partially, and leaves the others untouched.
Indexing and query tuning reduce per-query execution cost, and they are the right first step. But tuning does nothing about queueing delay or network distance, and its gains erode as data grows. A team that has already tuned its top queries usually finds that the remaining latency lives outside query execution entirely.
Read replicas add capacity for concurrent reads, which relieves queueing. They do not reduce scan cost (each replica runs the same expensive query against the same data volume), and unless a replica is placed in every region an application runs in, cross-region requests still pay the distance penalty. Replication lag also introduces staleness that application logic has to tolerate.
Result caching removes repeated work for repeated requests. Its weakness is coverage: a cache only accelerates queries it has seen before, so hit rates fall as query shapes become more varied (per-tenant filters, ad hoc analytics, AI agents composing their own SQL). It also introduces cache invalidation, which becomes its own scaling problem. The trade-offs between result caching and dataset-level approaches are covered in caching vs data acceleration.
Vertical scaling (a bigger instance) buys headroom on concurrency and memory at once, which is why it works, temporarily. It is also the fix that most clearly postpones rather than solves: cost grows faster than capacity at the high end, and a single larger box does nothing about network distance to far-away services.
None of these are wrong. The pattern to notice is that they all optimize the existing request path, while the underlying trend (more consumers, more data, more distance) keeps pushing in the other direction.
How to Diagnose Which Force Dominates
Before changing architecture, measure where the time actually goes. Three practices separate the signal from the noise.
Measure latency percentiles at the application, not averages at the database. Database-side metrics miss network time and connection acquisition, and averages hide the tail. A database reporting a healthy 15 ms mean can coexist with an application experiencing 500 ms at P99, and it is the P99 that users and dependent services experience. Track P50, P95, and P99 separately at the client.
Decompose a slow request into its segments. A query's end-to-end time is queueing (waiting for a connection or worker) plus network (round trips between service and database) plus execution (the part EXPLAIN ANALYZE shows). Distributed traces or client-side timers around connection checkout and query dispatch reveal the split. Each segment points to a different force: long checkout means concurrency, long round trips mean distance, long execution means data volume.
Correlate latency with load and data size, not with deploys. Latency that spikes with traffic peaks indicates queueing. Latency that grows month over month while traffic is flat indicates data growth. Latency that differs by region indicates distance. Plotting P99 against concurrent query count usually makes the dominant force obvious within a day of data.
Architecture Patterns That Keep Latency Flat
When diagnosis shows queueing, distance, or scan cost growing structurally, the durable fix is to change where queries run rather than to keep tuning how they run.
Co-locate a queryable copy of hot data with the application. Instead of every request crossing the network to a central database, a local engine (running as a sidecar or in-process with the service) holds the datasets the application reads most, and serves them at local latency. Distance drops to microseconds, and read concurrency stops competing for the central database's worker pool because reads never reach it.
Keep the local copy fresh with replication, not request-time fetches. Data acceleration materializes datasets into the local engine and refreshes them on a schedule or continuously through change data capture. Freshness becomes a declared property (a refresh interval or CDC stream) rather than per-request work, so serving latency stays flat regardless of how slow or busy the source is.
Scale the read path independently of the source. Because each application instance carries its own accelerated working set, adding instances adds read capacity linearly, without adding load to the system of record. The source database sizes for writes and the long tail of cold queries instead of for peak read traffic.
Federate the long tail instead of replicating everything. Not every dataset earns a local copy. A federated query layer serves rare or ad hoc queries directly from the source while hot paths stay local, which keeps the memory footprint of acceleration proportional to the working set rather than to the whole database.
Together these patterns invert the scaling relationship: instead of latency rising as consumers multiply, each new consumer brings its own serving capacity with it.
Advanced Topics
Tail latency amplification in fan-out requests
When one user request fans out into parallel queries, the request completes only when the slowest query returns. With 10 parallel queries, the probability that at least one lands in the database's slowest 1% is roughly 10%, so a P99 problem at the database becomes a P90 problem for users. This amplification is why tail latency, not median latency, sets the budget for service-oriented architectures, and why reducing variance (fewer queue waits, no cache misses, local reads) often matters more than reducing the median.
The utilization knee
Queueing theory predicts, and production systems confirm, that wait time stays low until utilization crosses roughly 70-80% of capacity, then rises steeply: each increment of load adds more wait time than the last. This knee explains why databases feel fine right up until they do not, and why capacity planning based on average utilization underestimates latency risk. Systems that must hold tight tail latency budgets are deliberately run well below the knee, which is another argument for offloading read traffic from shared infrastructure.
Connection pools and head-of-line blocking
Connection pools cap concurrent queries per service instance. When the pool is exhausted, new queries queue at the client before the database ever sees them, and one slow query holding a connection delays unrelated fast queries behind it. Symptoms are rising client-side latency while database-side metrics look healthy. Mitigations include separating pools for fast and slow query classes, aggressive timeouts on the slow class, and reducing demand on the pool by serving hot reads from a local engine.
Keeping Query Latency Flat with Spice
Spice implements the co-location pattern as a lightweight runtime that deploys next to the application, materializes hot datasets from any of 40+ data sources into a local engine, and keeps them current through scheduled refresh or change data capture. Queries run over the local copy at consistent, single-digit-millisecond latency while anything not accelerated federates transparently to its source, so the data lake or warehouse behind it stops being on the request path.
The pattern holds at production scale: Twilio runs Spice in its messaging control plane at P99 query times under 5 milliseconds, and Barracuda reduced email archive queries from a P99 of about 2 minutes to 100-200 milliseconds. For multi-tenant SaaS platforms, the same architecture shards a runtime per tenant so that one tenant's query load cannot degrade another's latency.
Query Latency at Scale FAQ
Why does database query latency increase as an application scales?
Three forces grow together when applications scale: concurrency, data volume, and distance; any one can dominate, and the standard fixes each address only one. More simultaneous queries compete for finite database workers, which creates queueing delay. Larger tables mean deeper indexes, lower cache hit rates, and more expensive scans. More services and regions query a centralized database and pay more network round trips.
What is tail latency and why does it matter more than average latency?
Tail latency is the slow end of the latency distribution, measured as P95 or P99. These are the times under which 95% or 99% of queries complete. It matters because users and dependent services experience the tail, not the average. A fan-out request is as slow as its slowest query, so a healthy average can hide a tail that breaks every latency budget.
Do read replicas fix query latency at scale?
Partially: read replicas add capacity for concurrent reads, which relieves queueing delay. They do not reduce the cost of scanning large tables, because each replica runs the same query against the same data volume. They reduce network distance only if you deploy a replica in every region where the application runs. Replication lag also introduces staleness the application must tolerate.
How does data locality reduce query latency?
Data locality places a queryable copy of frequently read datasets next to the application, in the same process, pod, or host. Reads then complete without crossing the network or competing for the central database's capacity. Network round trips drop from tens of milliseconds to microseconds, and latency stays predictable because local reads do not queue behind other consumers' traffic.
How does Spice keep query latency low as applications scale?
Spice deploys as a lightweight runtime co-located with the application. It accelerates hot datasets into a local engine: in-memory Apache Arrow, embedded DuckDB or SQLite, or Cayenne. It keeps them fresh through scheduled refresh or change data capture. Each application instance serves reads locally, so adding instances adds read capacity without adding load to the source database.
Learn more about low-latency data access
Guides and blog posts on keeping query latency flat as applications and data grow.
Data Acceleration Docs
Learn how Spice materializes and refreshes datasets locally for sub-second queries across in-memory and embedded engines.
Making Object Storage Operational for Real-Time and AI Workloads
Transform object stores into real-time AI platforms. Spice adds federation, acceleration, hybrid search, and inference capabilities.
Getting Started with Spice.ai SQL Query Federation & Acceleration
Learn how to use Spice.ai to federate and accelerate queries across operational and analytical systems with zero ETL.
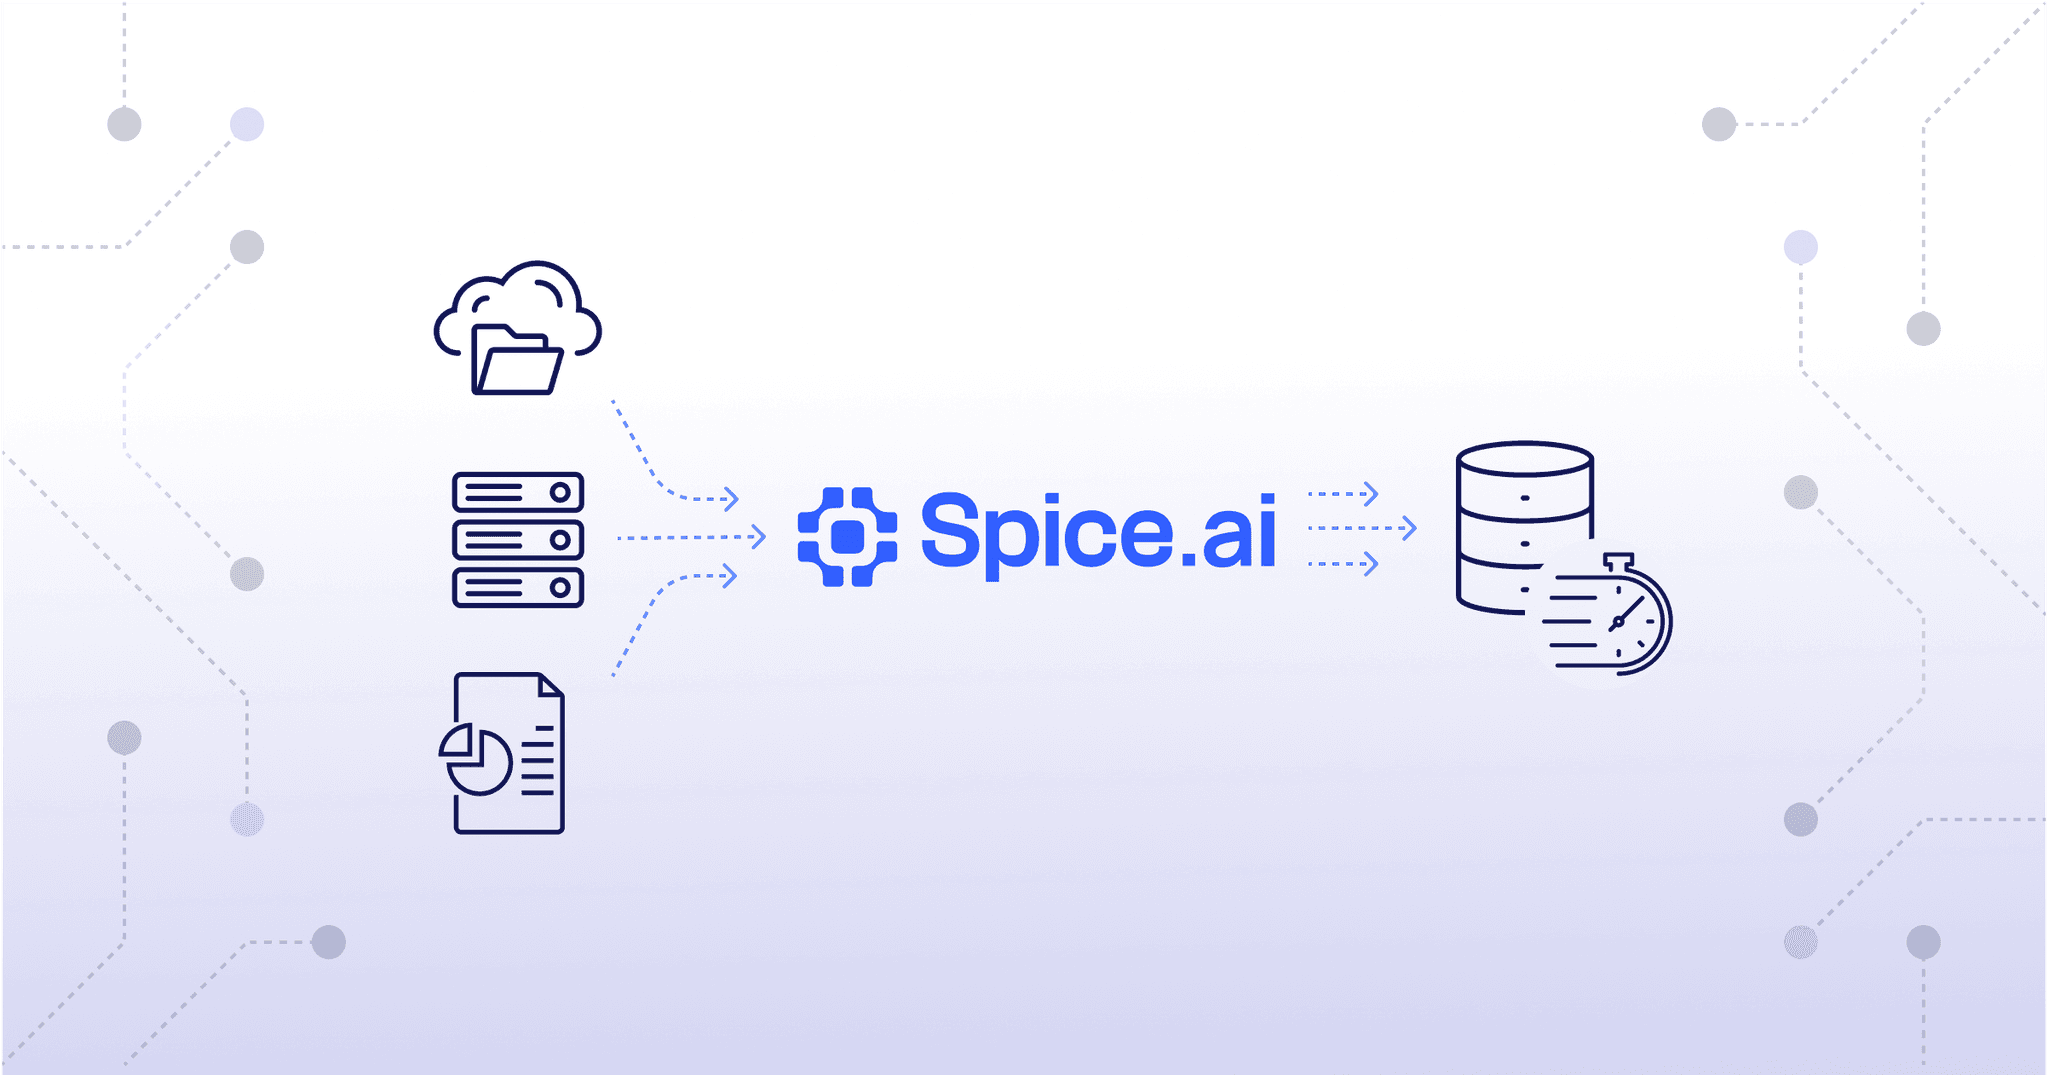
See Spice in action
Get a guided walkthrough of how development teams use Spice to query, accelerate, and integrate AI for mission-critical workloads.
Get a demo