Observability
First-class, built-in observability to understand the operations Spice performs.
Observability in Spice enables task tracking and performance monitoring through a built-in distributed tracing system that can export to Zipkin or be viewed via the runtime.task_history SQL table.
Spice records detailed information about runtime operations through trace IDs, timings, and labels - from SQL queries to AI completions. This task history system helps operators monitor performance, debug issues, and understand system behavior across individual requests and overall patterns.
Use-Cases
Debugging and Troubleshooting
- Trace AI chat completion steps and tool interactions to identify why a request isn't responding as expected
- Investigate failed queries and other task errors
Performance Analysis
- Track SQL query/tool use execution times
- Identify slow-running tasks
Usage Analytics
- Track usage patterns by protocol and dataset
- Understand how AI models are using tools to retrieve data from the datasets available to them
Portal Interface
The Spice platform provides a built-in UI for visualizing the observability traces that Spice OSS generates.
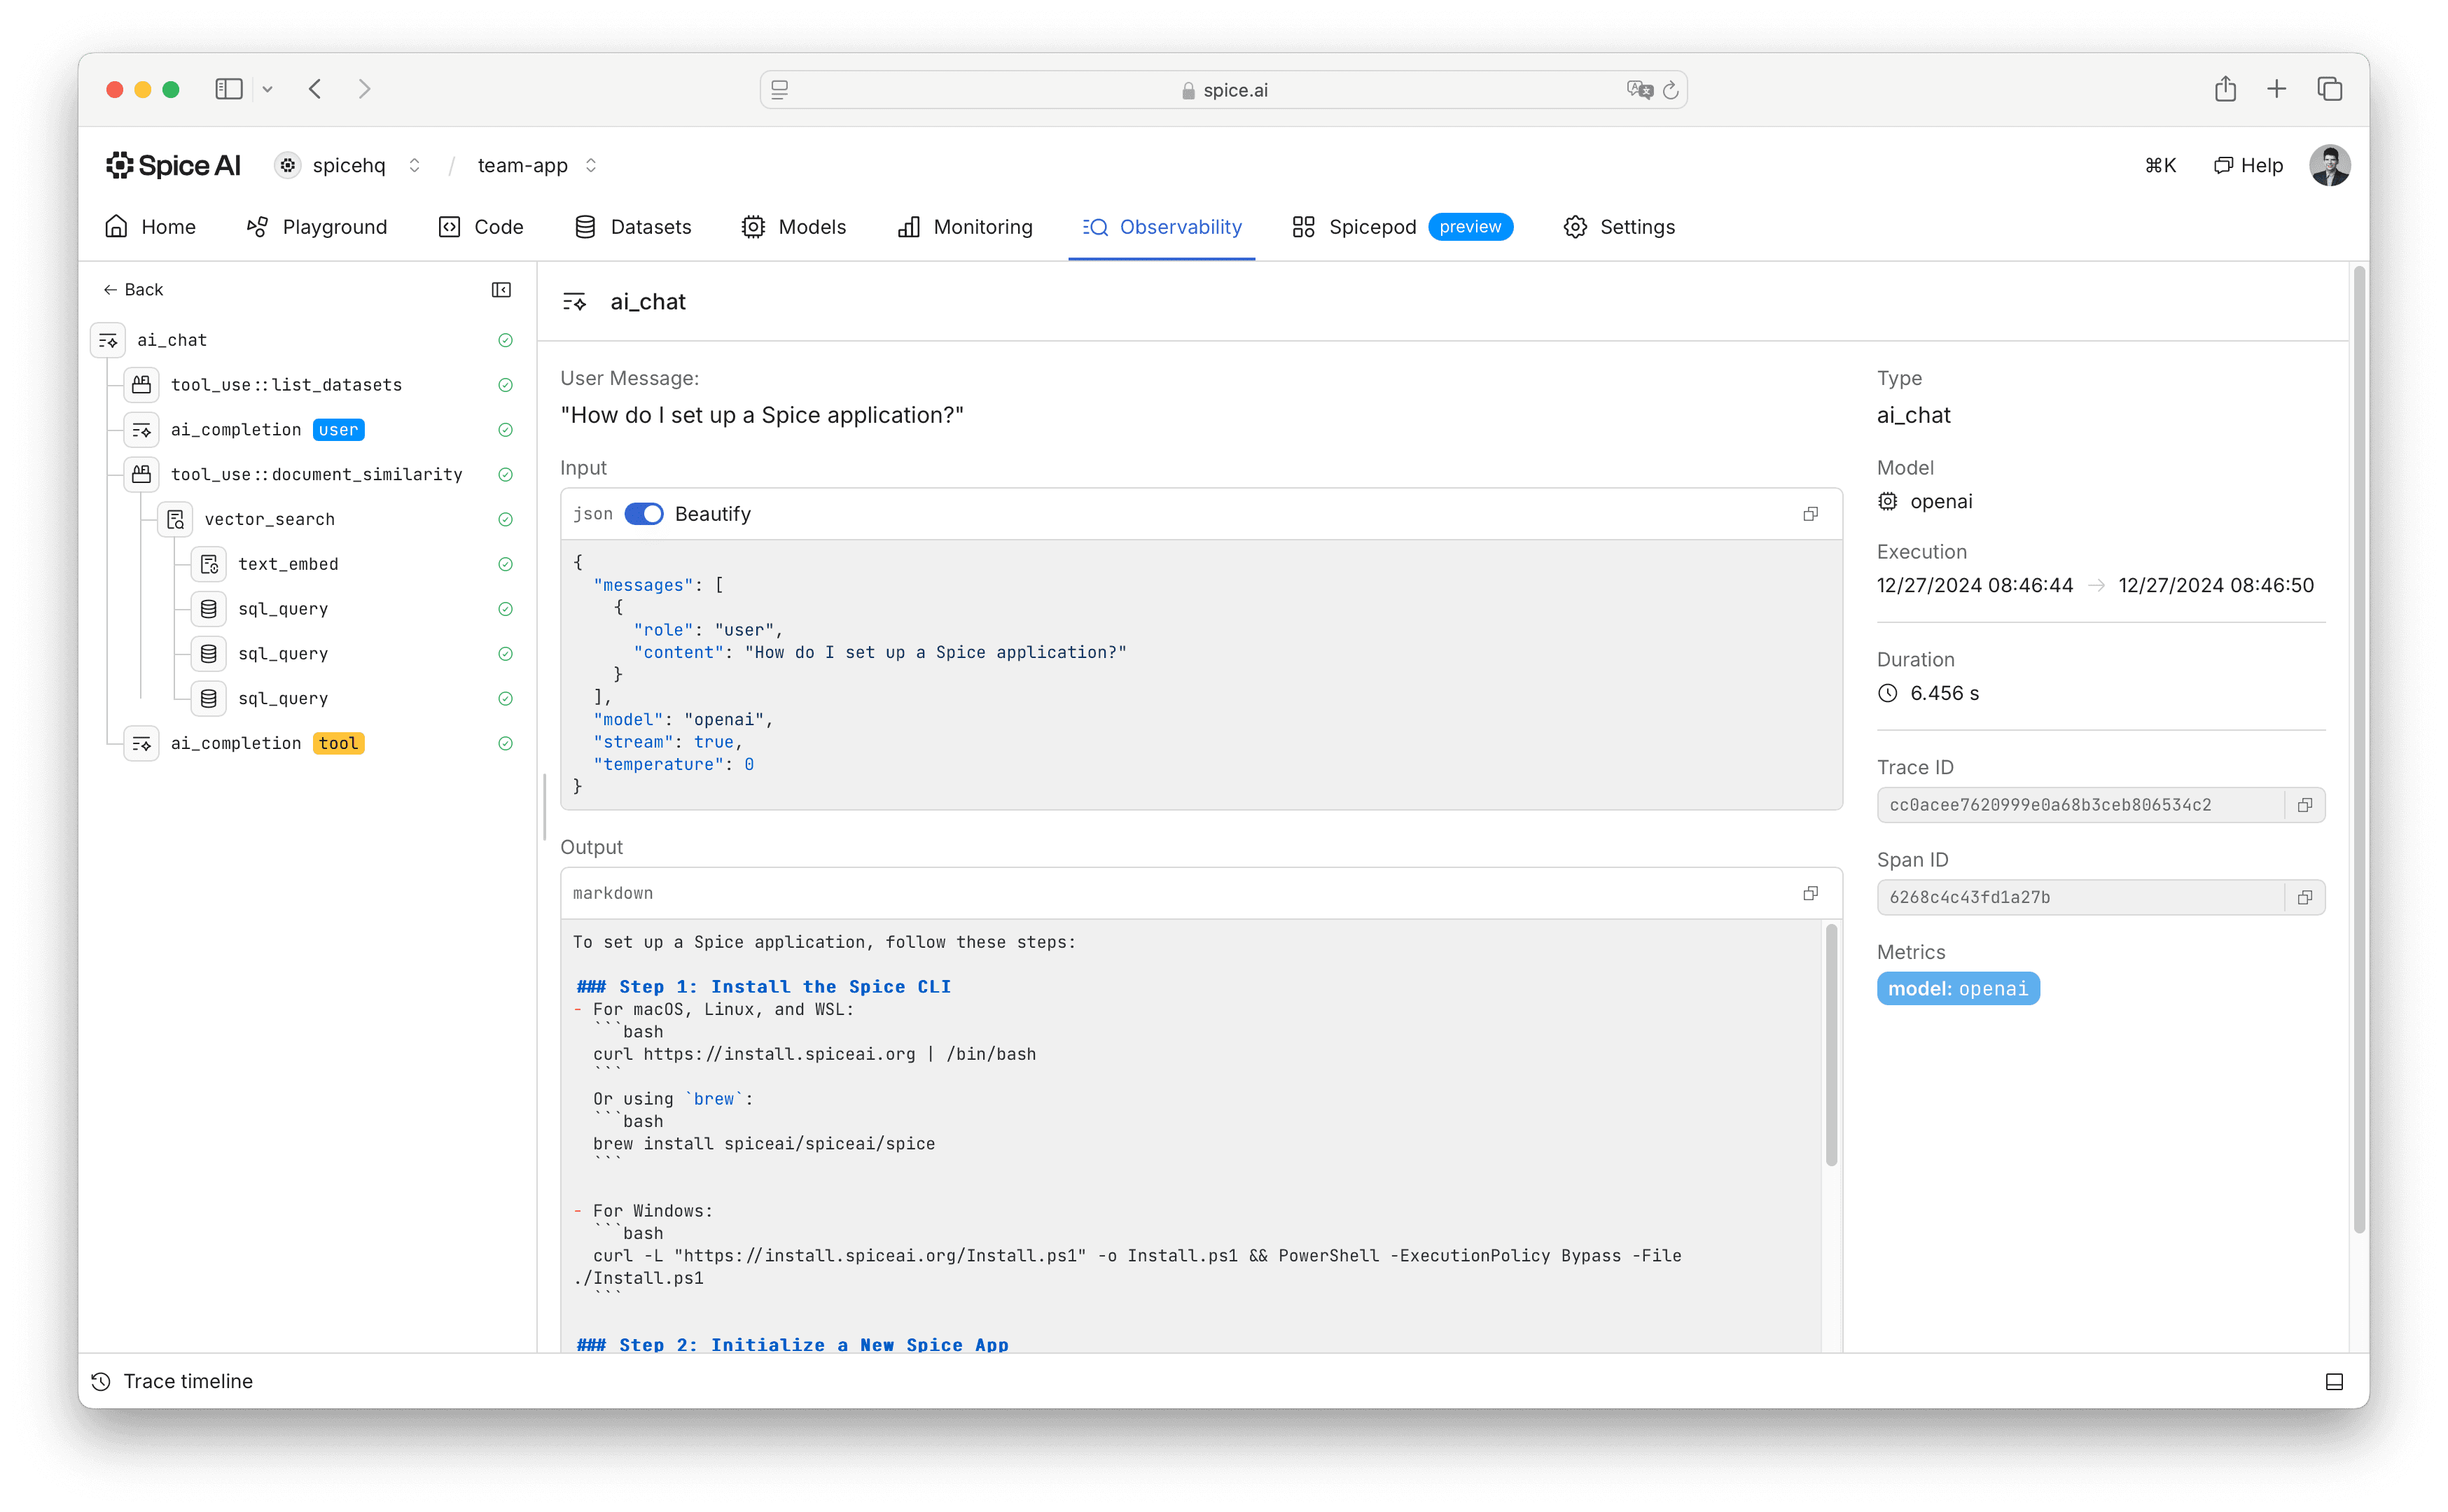
An observability trace for an AI chat completion in the Spice portal.