Real-Time Control Plane Acceleration with DynamoDB Streams
Data Acceleration
Engineering
Spice Cloud Platform
Spice OSS

Viktor Yershov
Senior Software Engineer at Spice AIJanuary 22, 2026
TL;DR: A global cloud communications company needed to sync their DynamoDB configuration to thousands of nodes with sub-second latency. Their multi-tier caching setup was creating cold start penalties, tight coupling, and TTL tuning overhead. The solution was a two-tier architecture using DynamoDB Streams and Spice data acceleration that eliminated cache complexity and delivered sub-second propagation.
The challenge: Decoupling the data plane from an OLTP app
A global cloud communications company came to us with a deceptively hard problem. They were building a new data processing platform with a clear separation between control and data planes:
Control plane: An OLTP application backed by DynamoDB where customers configure their data pipelines (a single-table design holding all configuration data).
Data plane: Thousands of processing nodes needing access to this configuration with single-digit millisecond latency. When customers update configurations, changes must reflect in the pipeline within seconds.
Their initial approach used multi-tiered caching: each data plane node ran a daemon with an in-memory LRU cache backed by DAX and DynamoDB. This led to three problems:
- Cold start penalty: Cache misses required network traversal to DAX or DynamoDB, adding latency
- Tight coupling: Data plane nodes directly coupled to the OLTP database-cache misses meant queries hitting DynamoDB
- TTL tuning overhead: Constant balancing between keeping hot data local and propagating changes quickly
What they really wanted was to decouple the data plane entirely from DynamoDB by accelerating the complete dataset locally on each node instead of falling back to the source on cache miss.
The solution: DynamoDB + local acceleration with Spice
In this post, we'll walk through how DynamoDB Streams and Spice keep accelerated datasets in sync across thousands of nodes - illustrating a pattern applicable to many distributed systems where control plane data needs to be available at the edge with ultra-low latency.
Introduction to Spice acceleration
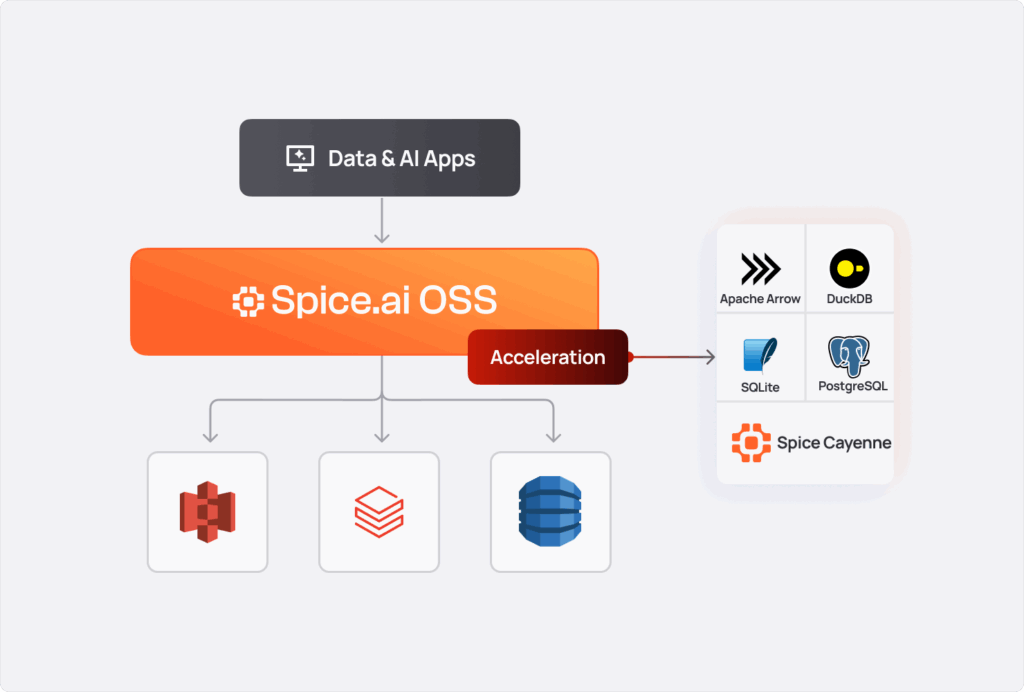
First, let's cover how Spice makes this architecture possible. Spice is a unified query, search, and LLM inference platform that enables data-intensive applications and AI agents. Spice can be deployed anywhere - in the cloud, on-premises, at the edge, or next to your application as a sidecar - and accelerates data access for teams querying disparate data sources with ultra-low latency.
Spice data acceleration materializes working sets from distributed data sources into local accelerator engines such as Arrow, SQLite, DuckDB, or Spice Cayenne for high-performance querying. By bringing frequently accessed data closer to compute, applications avoid repeated round-trips to source systems while achieving sub-second latency across operational and analytical workloads.
The target architecture
The customer's key requirements included:
- Scale to thousands of data plane nodes
- Single-digit millisecond read latency from local storage
- Sub-second replication from DynamoDB to accelerated datasets
- Support fast cold start so new nodes receive data within seconds
With Spice's acceleration capabilities in mind, we designed a two-tiered Spice architecture:
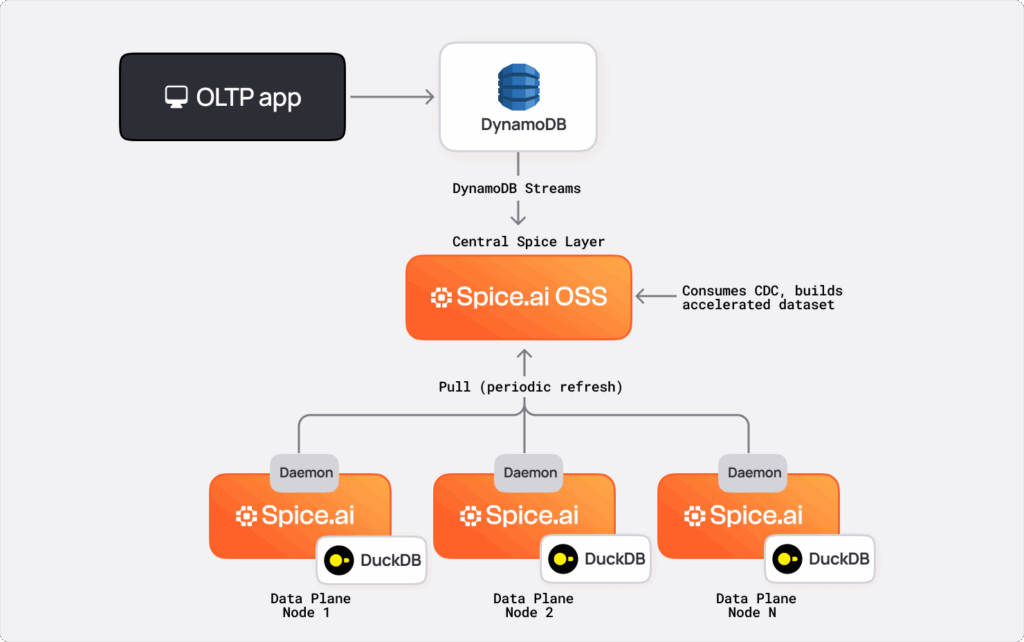
How it works:
- The central Spice layer consumes DynamoDB Streams and maintains a near-real-time accelerated dataset
- Each data plane node runs a local Spice daemon with SQLite or DuckDB that syncs from the central layer
- Data plane processes read from localhost - no network egress or coupling to DynamoDB
DynamoDB Streams vs Kinesis
DynamoDB offers two change capture options. We evaluated both:
- DynamoDB Streams provides exactly-once delivery with strict ordering within each shard. Records arrive in write order with no duplicates.
- Kinesis Data Streams can deliver duplicates and doesn't guarantee ordering, requiring deduplication logic on every message.
For keeping accelerated tables in sync, exactly-once delivery was decisive. We didn't want deduplication overhead, and the 24-hour retention is sufficient since we checkpoint continuously. The trade-offs-shorter retention and fewer consumers-were acceptable for this use case.
Bootstrapping: The checkpoint-first approach
When connecting a DynamoDB table to Spice, we need to load current state before consuming changes. This is trickier than it sounds.
The Problem with LATEST Iterators
The naive approach is to get a LATEST iterator for each shard, scan the table, and start consuming. But DynamoDB Streams iterators expire after 15 minutes. If your table takes longer to scan, your iterators are gone.
Buffering changes during scan has problems too. For high-throughput tables, you could exhaust memory. For idle streams, you might never receive a message to establish position.
Our solution: Checkpoint first, scan second
- Create a checkpoint at the current stream position by walking all shards and recording their sequence numbers.
- Scan the entire table and load all existing rows.
- Subscribe using the checkpoint from step 1 and start consuming from the recorded position.
let (should_bootstrap, checkpoint) =
    load_or_initialize_checkpoint(&dynamodb, &dataset_name).await?;

if should_bootstrap {
    let bootstrap_stream = Arc::clone(&dynamodb)
        .bootstrap_stream()
        .await
        .map(move |msg| {
            msg.map(|change_batch| {
                ChangeEnvelope::new(Box::new(NoOpCommitter), change_batch, false)
            })
        });
After bootstrap completes, we commit the checkpoint and start the changes stream:
bootstrap_stream
    .chain(
        stream::once(async move {
            let committer = DynamoDBStreamCommitter::new(checkpoint_cloned);
            if let Err(err) = committer.commit() {
                tracing::error!("Failed to commit bootstrap checkpoint: {:?}", err);
            }
            stream::empty()
        })
        .flatten()
    )
    .chain(changes_stream_from_checkpoint(&dynamodb, &checkpoint))
The time travel trade-off
The checkpoint points to a moment before the scan completes. Some changes during the scan will replay afterward. The table can briefly go back in time-a row might update to an older value before catching up.
We mitigate this by not marking the dataset ready until stream lag drops below a threshold (default 2 seconds). Downstream consumers only see the dataset once it's caught up.
This approach works for any table regardless of size or throughput. There's no dependence on receiving messages within a window and no unbounded memory buffering.
Cold start and snapshotting
For the customer's use case, cold start performance was critical. New data plane nodes need to spin up with data ready in seconds, not minutes.
Our solution is to snapshot the accelerated dataset to object storage with the checkpoint embedded:
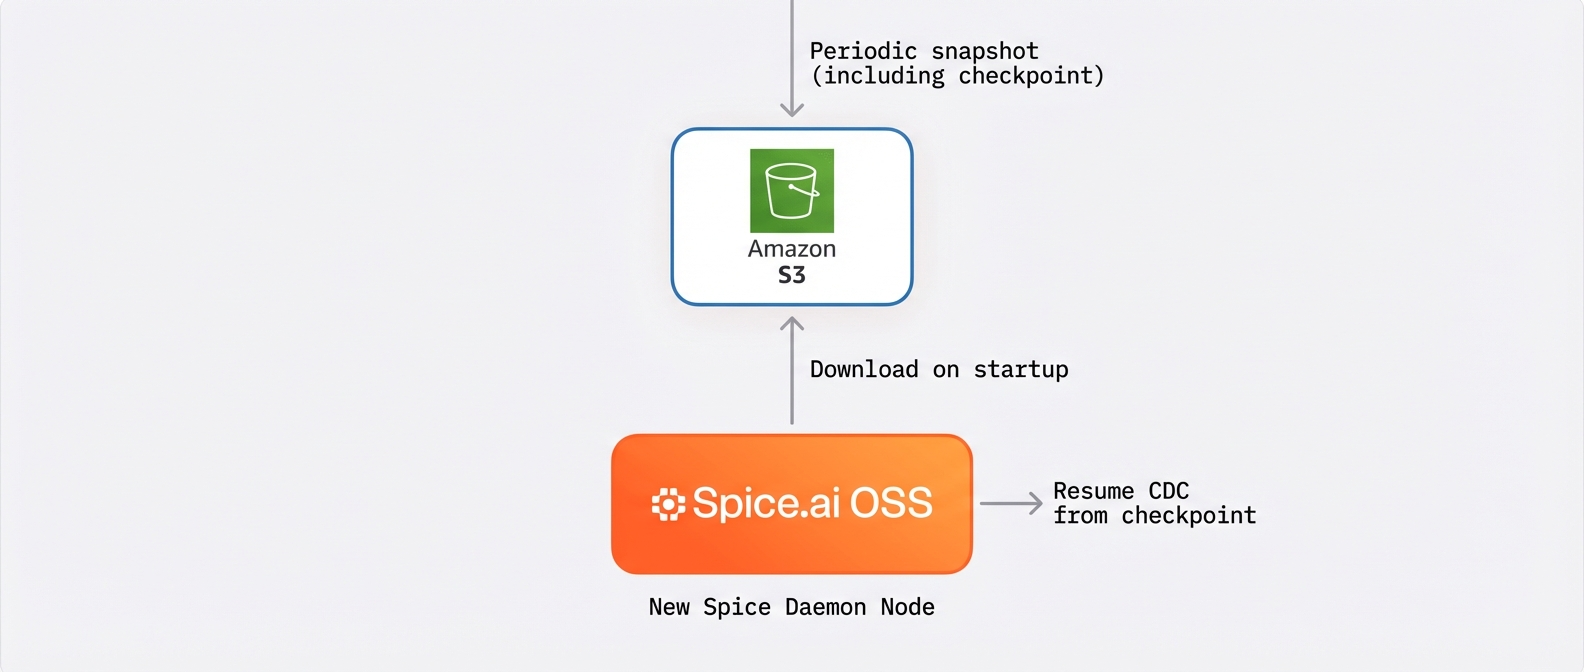
When a new node starts, it downloads the latest snapshot from S3, reads the embedded watermark, and resumes the CDC stream from that position.
This gets nodes operational in seconds rather than re-scanning the entire source table. For a dataset of a few gigabytes, startup time drops from minutes to single-digit seconds.
Shard management with a pure state machine
DynamoDB Streams organizes data into shards with parent-child relationships. You must fully process a parent before reading children to maintain ordering.
We modeled this as a state machine:
pub struct StreamState {
    active: HashMap<String, ActiveShard>,
    initializing: HashMap<String, InitializingShard>,
    blocked: HashMap<String, BlockedShard>,
    historical: HashMap<String, HistoricalShard>,
}
The key insight was to keep state transitions pure. All transitions happen through methods that take input and return results without external API calls:
pub fn handle_poll_result(
    &mut self,
    shard_id: &str,
    new_iterator: Option<String>,
    records: Vec<Record>,
) -> Result<ShardPollResult> {
    if let Some(iter) = new_iterator {
        self.active.get_mut(shard_id)?.update_iterator(iter);
    } else {
        self.active.remove(shard_id);
        self.promote_children(shard_id);
    }
}
When a shard exhausts, we promote its children from 'blocked' to 'initializing'. This separation means we can test every state transition without mocking AWS.
Error handling: Transient vs fatal
Errors fall into two categories:
pub enum Error {
    // Permanent - require intervention
    TableNotFound,
    StreamNotFound,
    StreamBeyondRetention,

    // Retriable - resolve with retry
    Timeout,
    ConnectionFailure,
    Throttled,

    // Special handling
    IteratorExpired,
}
Iterator expiration needs special treatment. DynamoDB Streams iterators expire after 15 minutes of inactivity. You can't retry with the same iterator - you need a new one from your last checkpoint:
 if error.is_retriable() {
        tracing::warn!("Poll error for shard {}, will retry: {}", shard_id, error);
        Ok(())
    } else if matches!(error, Error::IteratorExpired) {
        tracing::warn!("Iterator expired for shard {}, reinitializing", shard_id);
        reinitialize_shard_with_checkpoint(shard_id);
        Ok(())
    } else {
        Err(error)
    }
}
For transient errors, exponential backoff with a 60-second cap prevents thundering herds while recovering quickly from brief network issues.
Watermarks and dataset readiness
To track how far behind real-time we are, we use watermarks based on each record's approximate creation time. The minimum watermark across active shards indicates global progress.
fn combine_shard_batches(poll_results: &[ShardPollResult]) -> DynamoDBStreamBatch {
    let mut shard_watermarks = Vec::new();

    for shard_result in poll_results {
        let is_watermark_eligible = match &shard_result.outcome {
            PollOutcome::Records { .. } => true,
            PollOutcome::Failed => true,  // Failed shards represent unprocessed lag
            PollOutcome::Empty => false,  // Empty shards are caught up
        };

        if is_watermark_eligible {
            if let Some(watermark) = shard_result.current_watermark {
                shard_watermarks.push(watermark);
            }
        }
    }

    let watermark = shard_watermarks.into_iter().min()
        .unwrap_or_else(SystemTime::now);
 }
This watermark drives dataset readiness. A dataset is marked ready when lag drops below the threshold so downstream consumers don't see stale data during catch-up.
ChangeEnvelope::new(
    Box::new(committer),
    change_batch,
    lag.is_some_and(|l| l < acceptable_lag),  // Ready signal
)
For the customer's use case, this means data plane processes don't see the local dataset until it's within 2 seconds of real-time-no stale reads during catch-up.
Checkpointing for reliability
Checkpoints capture sequence number positions for each shard:
pub struct ShardCheckpoint {
    pub sequence_number: String,
    pub parent_id: Option<String>,
    pub updated_at: SystemTime,
    pub position: CheckpointPosition,
}

pub enum CheckpointPosition {
    At,    // Resume AT this sequence (inclusive) - not yet processed
    After, // Resume AFTER this sequence (exclusive) - already processed
}
On recovery, we resume from leaf shards only - those with no children in the checkpoint. Parents are already exhausted:
pub fn leaf_shards(&self) -> Vec<(&String, &ShardCheckpoint)> {
    let parent_ids: HashSet<&str> = self.shards.values()
        .filter_map(|sc| sc.parent_id.as_deref())
        .collect();

    self.shards.iter()
        .filter(|(shard_id, _)| !parent_ids.contains(shard_id.as_str()))
        .collect()
}
Checkpoints serialize as JSON to Spice's file-accelerated storage, enabling reliable resume after restarts.
Scaling to thousands of nodes
With thousands of data plane nodes, having each node consume directly from DynamoDB Streams isn't realistic. The central Spice layer acts as a fan-out point.
Edge nodes poll the central layer on a configurable interval using an append refresh strategy. This scales well - each edge node independently pulls updates without coordinating with others. Nodes can also filter to pull only relevant partitions, reducing data transfer for deployments where different node pools need different data subsets.
For the customer's use case, different teams had different requirements: one had fewer nodes but larger datasets, while the other had smaller datasets across more nodes. The pull-based architecture handles both patterns efficiently.
Metrics and monitoring
DynamoDB Streams lacks built-in lag metrics, so we built our own and exposed them through OpenTelemetry:
pub struct MetricsCollector {
    pub active_shards_number: RwLock<usize>,
    pub records: AtomicUsize,
    pub transient_errors: AtomicUsize,
    pub watermark: RwLock<Option<SystemTime>>,
}
Exposed through OpenTelemetry:
shards_active: Current active shards being polledrecords_consumed_total: Total records since startuplag_ms: Current lag from watermark to wall clockerrors_transient_total: Recoverable error count
The lag metric is especially important for the customer's SLA; they need to verify configuration changes propagate within seconds.
Configuration: A complete example
One of our design principles is making everything as easy as possible for developers. Here's a complete Spicepod configuration implementing the architecture described above:
version: v1
kind: Spicepod
name: dynamodb-streams-demo

snapshots:
  enabled: true
  location: s3://<path>
  bootstrap_on_failure_behavior: fallback
  params:
    s3_auth: key
    s3_key: ${secrets:AWS_ACCESS_KEY_ID}
    s3_secret: ${secrets:AWS_SECRET_ACCESS_KEY}
    s3_region: us-east-2

datasets:
  - from: dynamodb:<table>
    name: <table>
    params:
      dynamodb_aws_region: ap-northeast-2
      dynamodb_aws_auth: iam_role
    acceleration:
      enabled: true
      refresh_mode: changes
      engine: duckdb
      mode: file
      snapshots: enabled
      snapshots_trigger: time_interval
      snapshots_trigger_threshold: 2m
    metrics:
      - name: shards_active
      - name: records_consumed_total
      - name: lag_ms
      - name: errors_transient_total
This configuration points Spice at a DynamoDB table, enables CDC, accelerates to DuckDB, snapshots to S3 for fast cold start, falls back to bootstrap if snapshot loading fails, and exposes key metrics.
That's it. No custom CDC consumers to build, checkpoint management code to write, or shard tracking logic to maintain. Point it at your table and start querying.
The magic moment
When our customer first deployed this configuration, their feedback was immediate: "It was too easy." They had expected weeks of integration work. Instead, they had real-time DynamoDB synchronization running in an afternoon.
Lessons learned
- Choose abstractions that match your guarantees: DynamoDB Streams' exactly-once delivery saved us from deduplication complexity. The "simpler" option with fewer features was actually less work.
- Bootstrap carefully: The checkpoint-first approach handles edge cases that naive strategies miss-large tables, idle streams, memory constraints. Temporary "time travel" during catch-up is an acceptable trade-off.
- Pure state machines pay off immediately: Separating state transitions from I/O made shard management testable and easy to reason about.
- Build observability from day one: Without AWS-provided lag metrics, we built our own. Having watermarks and lag tracking from the start made debugging and operations much easier.
- Design for the scaling requirements: The two-tier architecture with push/pull flexibility handles both the "few nodes, large data" and "many nodes, small data" patterns the customer needed.
The architecture is extensible. If we need Kinesis Data Streams support for longer retention, the core state machine and checkpointing logic can be reused with a deduplication layer on top.
Conclusion
This pattern of using real-time change data capture to decouple application data planes from OLTP systems is increasingly common in modern, distributed architectures. What made this particular customer challenge compelling was the combination of strict latency requirements, thousands of downstream consumers, and the need for operational simplicity.
By treating DynamoDB Streams as a reliable source of truth and pairing it with accelerated, local query engines, we were able to eliminate cache complexity, remove DynamoDB from the application critical path, and deliver configuration changes across the fleet in seconds.
The same approach generalizes well beyond this use case: any system that needs fast, consistent access to changing data without rebuilding custom CDC consumers or managing fragile caching layers can benefit from this architecture.
Get started
Check out the Spice DynamoDB connector docs, Spice's broader CDC support, and the below demo for overviews on using Spice and DynamoDB.
And if you want to dig deeper into architectures like this, ask questions, or share what you're building, join the Spice community on Slack.
Explore more Spice resources
Hands-on tutorials, product docs, and real-world examples.
A Developer’s Guide to Understanding Spice.ai
This guide helps developers build a mental model of why, how, and where to use Spice.

Spice Cloud v1.11: Spice Cayenne Reaches Beta, Apache DataFusion v51, DynamoDB Streams Improvements, & More
Spice Cloud v1.11 focuses on what matters most in production: faster queries, lower memory usage, and predictable performance across acceleration and caching.
How we use Apache DataFusion at Spice AI
Why we chose to build on DataFusion and how we extended it with custom TableProviders, optimizer rules, and UDFs for federated SQL

See Spice in action
Walk through your use case with an engineer and see how Spice handles federation, acceleration, and AI integration for production workloads.
Talk to an engineer